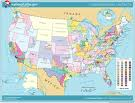
 Education, human services and business researchers will love “SimplyMap’s” interactive interface and ability to create custom maps for a wide range of census, market, and consumer variables.
Accessible through UC Libraries A to Z List of Databases, SimplyMap allows the researcher to create custom maps based on variables like income, education, quality of life, market segments, consumer goods, health characteristics, ancestry and more! You can also use SimplyMap to create exportable custom reports in Word and Excel. SimplyMap uses Mediamark Research’s (MRI©) Survey of the American Consumer to produce local estimates of usage and consumption for thousands of specific and detailed products and services. It uses Points-of-Interest (POI) data, PRIZM™ from Nielson Claritas data that defines every U.S. Household in terms of 66 demographic and behavior types, and Experian SimmonsLOCAL: a powerful targeting and profiling system that provides insights into consumer behavior for all of America’s 210 media markets.
Before using SimplyMap, you will need to register by creating a login ID and password. Go to SimplyMap to create your own custom demographic maps and reports!
