The science and history of climate change is intrinsically tied up with the practice of recordkeeping. In climate change conversations we often talk about “records” as in, “the hottest summer on record” or “a record level of flooding.” But those notable milestone records do not reveal themselves – they are revealed because of bits of data, created through the practice of observational recordkeeping, constituting a baseline that makes notable records possible.
One of the longest running data sets related to climate change are the Mauna Loa observatory records from Hawaii. These measurements, still carried out today, record atmospheric carbon dioxide concentrations, and were begun by Charles Keeling in 1958. The resulting diagram of the measurements, popularly known as the Keeling curve, shows an unmistakable rise in atmospheric concentration of carbon dioxide since it began. The Keeling curve is one of the most important pieces of documentary evidence in demonstrating the phenomenon of climate change, and human contribution towards creating climate change through increased greenhouse gas emissions.

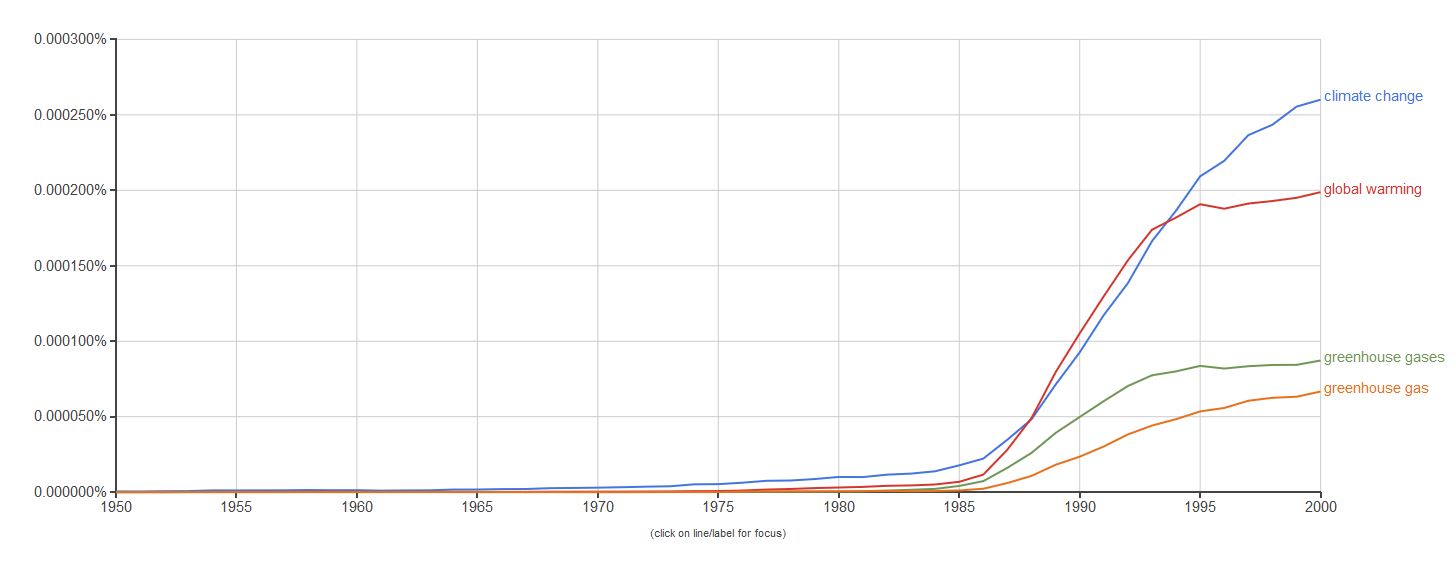
The phenomena of climate change is all around us today. But it took decades of maintaining meticulous observational data records, and unearthing other forms of data through historical climate surrogate or proxy records, for climate change to enter mainstream scientific consciousness, let alone popular culture. Scientists had been discussing climate change in disciplinary publications and conferences since the 1960s. But climate change did not begin to enter mainstream conversation or awareness until the mid-1980s. After 1985, various phrases like climate change, global warming, and greenhouse gases began to appear in popular culture. An example of this can be seen in looking at the Google Books Ngram viewer, which registers phrases that appear in its corpus of 5 million digitized books. Around 1986, a major rise begins to take shape, and it gains major steam through the late 1980s.

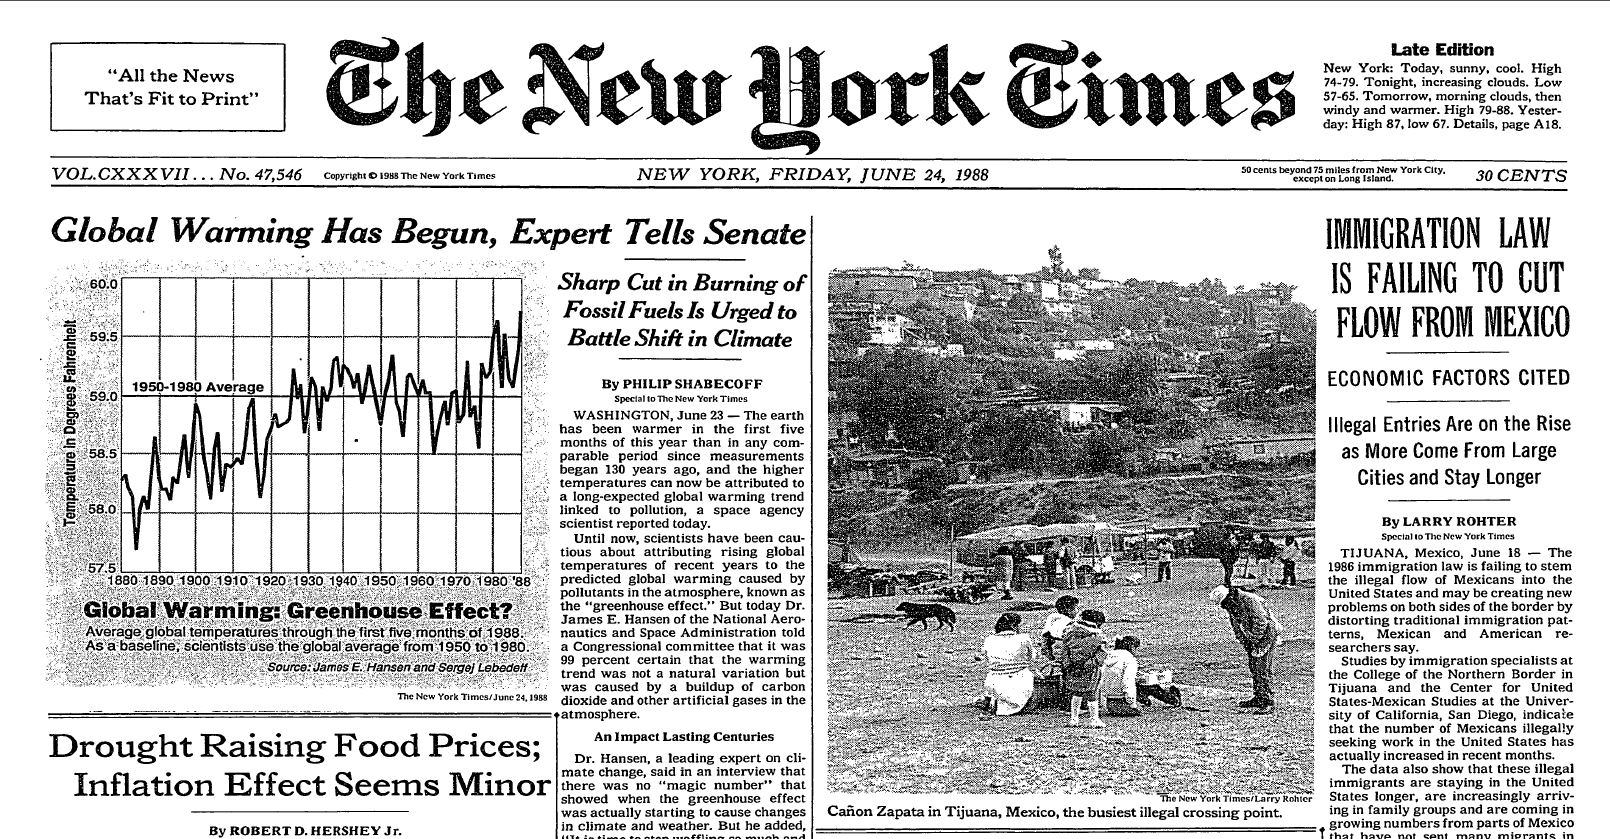
So what happened in the mid-80s? Several landmark events. One was the Montreal Protocol, which developed international cooperation in reducing the use of chloroflourocarbons (CFCs), which had contributed to the ozone hole. The awareness and international response to the ozone hole helped the public understand the degree to which human activity could adversely impact the environment. Then in 1988, a NASA scientist named James Hansen appeared before Congress during unusually hot summer weather to give testimony that global climate change was happening due to the use of fossil fuels, and that the United States needed to prepare for it.

The New York Times reported that “Dr. Hansen, who records temperatures from readings at monitoring stations around the world, had previously reported that four of the hottest years on record occurred in the 1980’s. Compared with a 30-year base period from 1950 to 1980, when the global temperature averaged 59 degrees Fahrenheit, the temperature was one-third of a degree higher last year. In the entire century before 1880, global temperature had risen by half a degree, rising in the late 1800’s and early 20th century, then roughly stabilizing for unknown reasons for several decades in the middle of the century.” Until this time climate scientists had been hesitant to call for major public policy changes towards averting climate disaster. Hansen’s examination of over 100 years of weather station records led to his determination that global temperature rise was on enough of an upward trajectory than the alarm bell had to be rung.
