Seeing the Story in Data Series – Kick off Talk – Vetria Byrd PhD

logo for the Data and Computational Science Series 20200


JOIN us for the first in a four part data visualization series entitled:

Seeing the Story in the Data

A well thought out and designed visualization can convey meaning and deep insight into vast amounts of data.  In this four part lecture series, data visualization researchers and experts will discuss visualizations from different disciplines and highlight choices made to find the “so what”.

This series is a part of the Data and Computational Science Series.

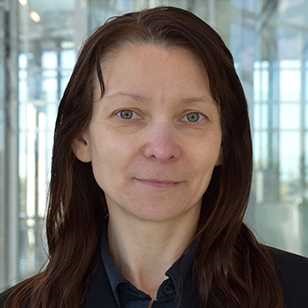
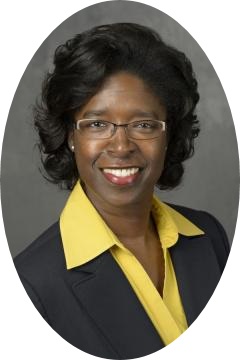
Our first speaker will be Vetria Byrd PhD Assistant Professor of Computer Graphics Technology at Purdue University.  Dr. Byrd is interested in interdisciplinary research topics such as uncertainty visualization (it’s role and impact on reasoning in decision-making), big data, and high performance visualization.

Title: The Role of Data Visualization in Science and Computational Science

Date: March 2, 2022

Time: 3:00 pm – 4:00 pm EST

 Please register https://ce.uc.edu/FacDev/Workshops/Details/17323 for the zoom link

This free event is hosted by UC Libraries Research and Data Serivces and the Office of Research – Research Computing and Data and funded by the Office of the Provost Universal Provider Grant and is open to all.

Art Education Exhibit in the DAAP Library

Flavia Bastos’s Art Ed. 7041 Graduate Seminar created modified books that illustrate concepts in Art Education History. Please come to the library to view this exciting and creative exhibit! (Located across from circulation desk).

exhibit of art education artists' books

Data Visualization Lunch & Learn and Hands-on Shiny Workshop – Nov 28th 11:45 am to 3 pm

Join us Wednesday, November 28 for a Lunch & Learn and Hands-on Shiny Workshop with Dr. Olga Scrivner, Research Scientist at Indiana University’s Cyberinfrastructure for Network Science Center. REGISTER

Olga Scrivner is a research scientist at Cyberinfrastructure for Network Science Center (CNS) in the School of Informatics, Computing, and Engineering at Indiana University, a faculty fellow at the Center of Excellence for Women in Technology, and a corporate faculty in Data Analytics at Harrisburg University of Science and Technology. She has substantive expertise in developing web application tools for data mining and visualization using Shiny and R. Her current research at CNS focuses on mapping of occupational landscape and educational attainment, with specific emphasis in understanding the healthcare workforce in the areas affected by opioid epidemic.

Wednesday November 28 in Langsam Library room 475  LUNCH WILL BE PROVIDED.


11:45AM – 1PM: LUNCH & LEARN – THE IMPORTANCE OF DATA VISUALIZATION
If a picture is worth of a thousand words, data visualization is worth millions: Toward a framework for actionable visual insights
Current shift in scientific landscape toward cross-disciplinary teams, evolving cyberinfrastructure and complex data requires a new kind of data analysis and visualization tools. This talk will introduce a visualization framework developed at Cyberinfrastructure for Network Science Center (CNS) at Indiana University, founded and directed by Professor Katy Börner, Victor H. Yngve Distinguished Professor of Engineering and Information Science (http://cns.iu.edu).


1PM – 3PM: BUILDING INTERACTIVE WEB APPLICATIONS: DATA VISUALIZATION WITH SHINY
This two hour hands-on workshop will step through the process of building, visualizing, deploying, and sharing Shiny web applications. Learning this workflow will enable you to build your own interactive tools that can be used for research and teaching.

Richard Johansen Joins UC Libraries as Data Visualization Specialist

richard in front of visualization wall

Richard poses in front of the Visualization Wall.

On Monday, April 23,  Richard Johansen started work in the Geology-Mathematics-Physics Library as Data Visualization Specialist.

Richard is already a fellow UC Bearcat, previously serving as a Research Assistant in the College of Arts and Sciences’ Department of Geography and GIS. He has worked on a host of interdisciplinary projects, and has a wealth of experience in spatial and data analyses using a variety of analytical and visualization software. Richard is currently a PhD candidate in UC’s Geography and GIS Department, and holds a BS in geosciences and a MA in geography and planning. Outside of work, he is an avid traveler, bizarre food lover and self-described space nerd.

As the Data Visualization Specialist, Richard joins the Science and Engineering Libraries unit and the Researcher Services team.  He will develop a distinctive program of support in data visualization that will enable innovations in teaching and research.  As part of this work, he will manage the new Visualization Laboratory located in the Geology-Mathematics-Physics Library, including its operations and technology.  More broadly, he will be a resource and consultant for faculty and scholars on visual thinking and data visualization techniques and software.

Welcome, Richard, to UC Libraries!