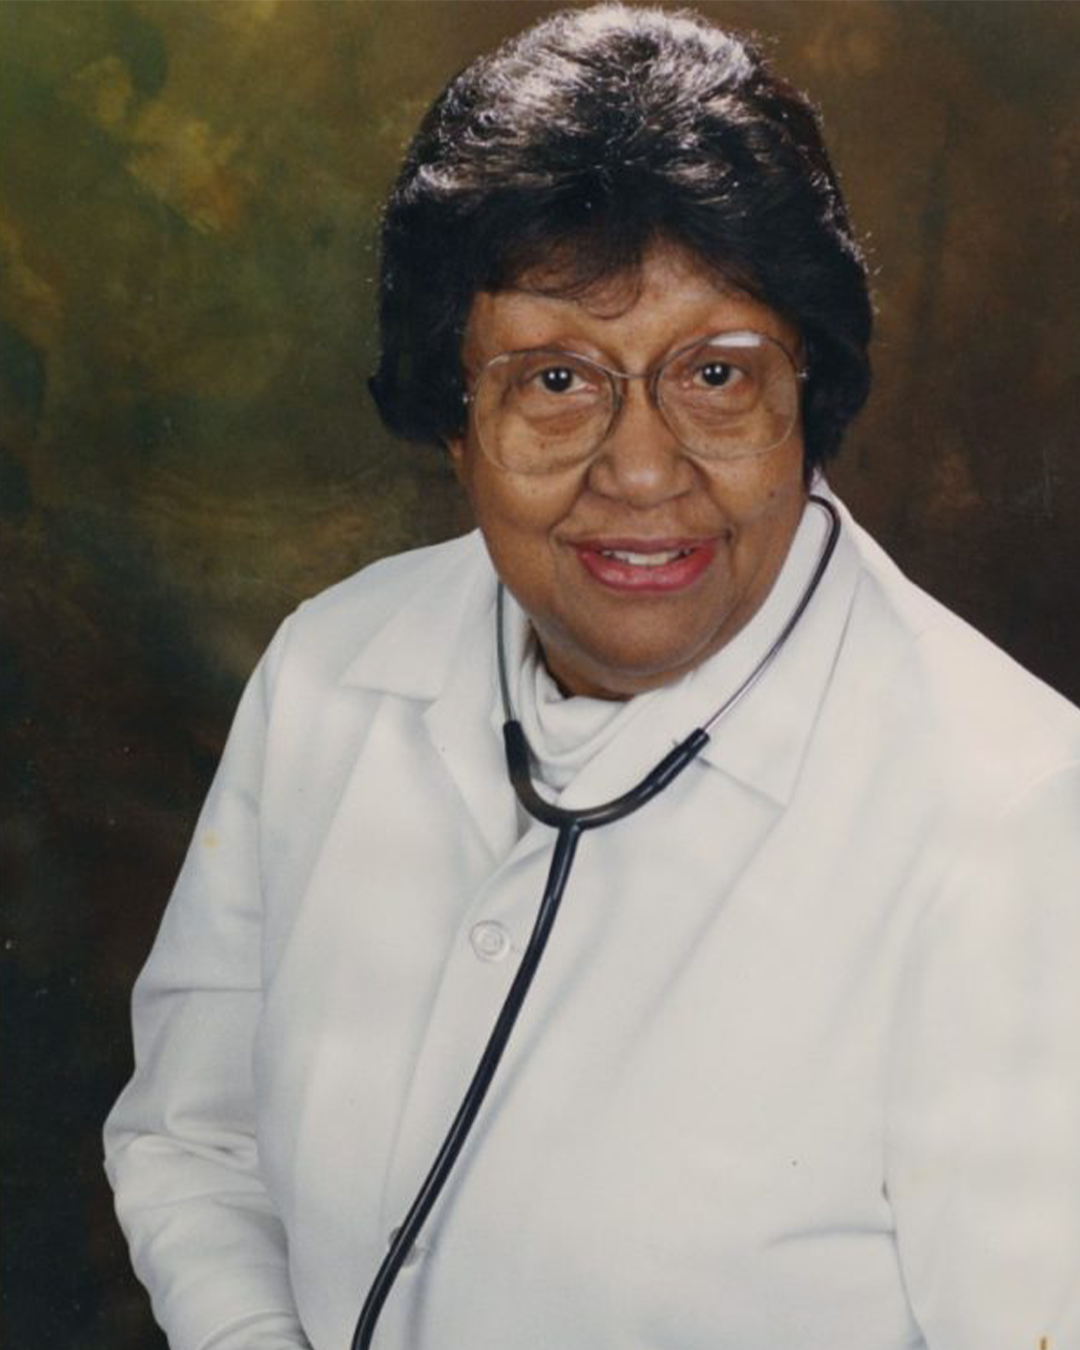
Our second Black History Month spotlight goes to a pioneer of medicine in the Cincinnati area, Lucy Oxley – the first African American to graduate from the University of Cincinnati College of Medicine.
Lucy Oxley was born in Harrisburg, Pennsylvania in 1912. During her childhood, her family moved to Cincinnati, as her father was named rector of St. Andrew’s Episcopal Church. As a young girl, Oxley looked up to three of her uncles who became doctors and knew early on that she wanted to be one too. She graduated early from Woodward High School and joined the University of Cincinnati College of Medicine’s six-year undergraduate and medical program.
During her time at UC, Oxley excelled, working hard to earn her spot in the group of top fifteen students who would have the chance to intern at General Hospital (UC Medical Center). However, she was refused an internship spot. When she questioned Dr. Alfred Friedlander about why she wasn’t given an internship, he said to her, “Lucy, you are a negro, and we don’t want you.” Oxley replied, “Well Dr. Friedlander, I wouldn’t change that for anything.” Rising above the prejudice, she went on to complete her internship at Freedmen’s Hospital in Washington, DC, and returned to Cincinnati to join her classmates for graduation on June 5, 1936.
After graduation, Oxley became a medical director for student wellness at Bennett College in North Carolina, and then Wilberforce College here in Ohio. Following that, she had a daughter, Francine, and returned to Cincinnati where she started her general practice. In 1945 she began working in cancer research alongside fellow UC grad, George Sperti. A few years later she returned to full-time practice in family medicine where she cared for thousands of patients and families.
Later in life, Oxley was diagnosed with lung cancer but continued to treat patients up until her passing in 1991. She is remembered today for her dedication to those she cared for and for paving the way for young African Americans who aim to make a difference in the medical field just as she did.
These 5-minute presentations showcase current research of UC Blue Ash faculty, spark conversation, encourage collaboration, and inspire action within the UC Blue Ash community.
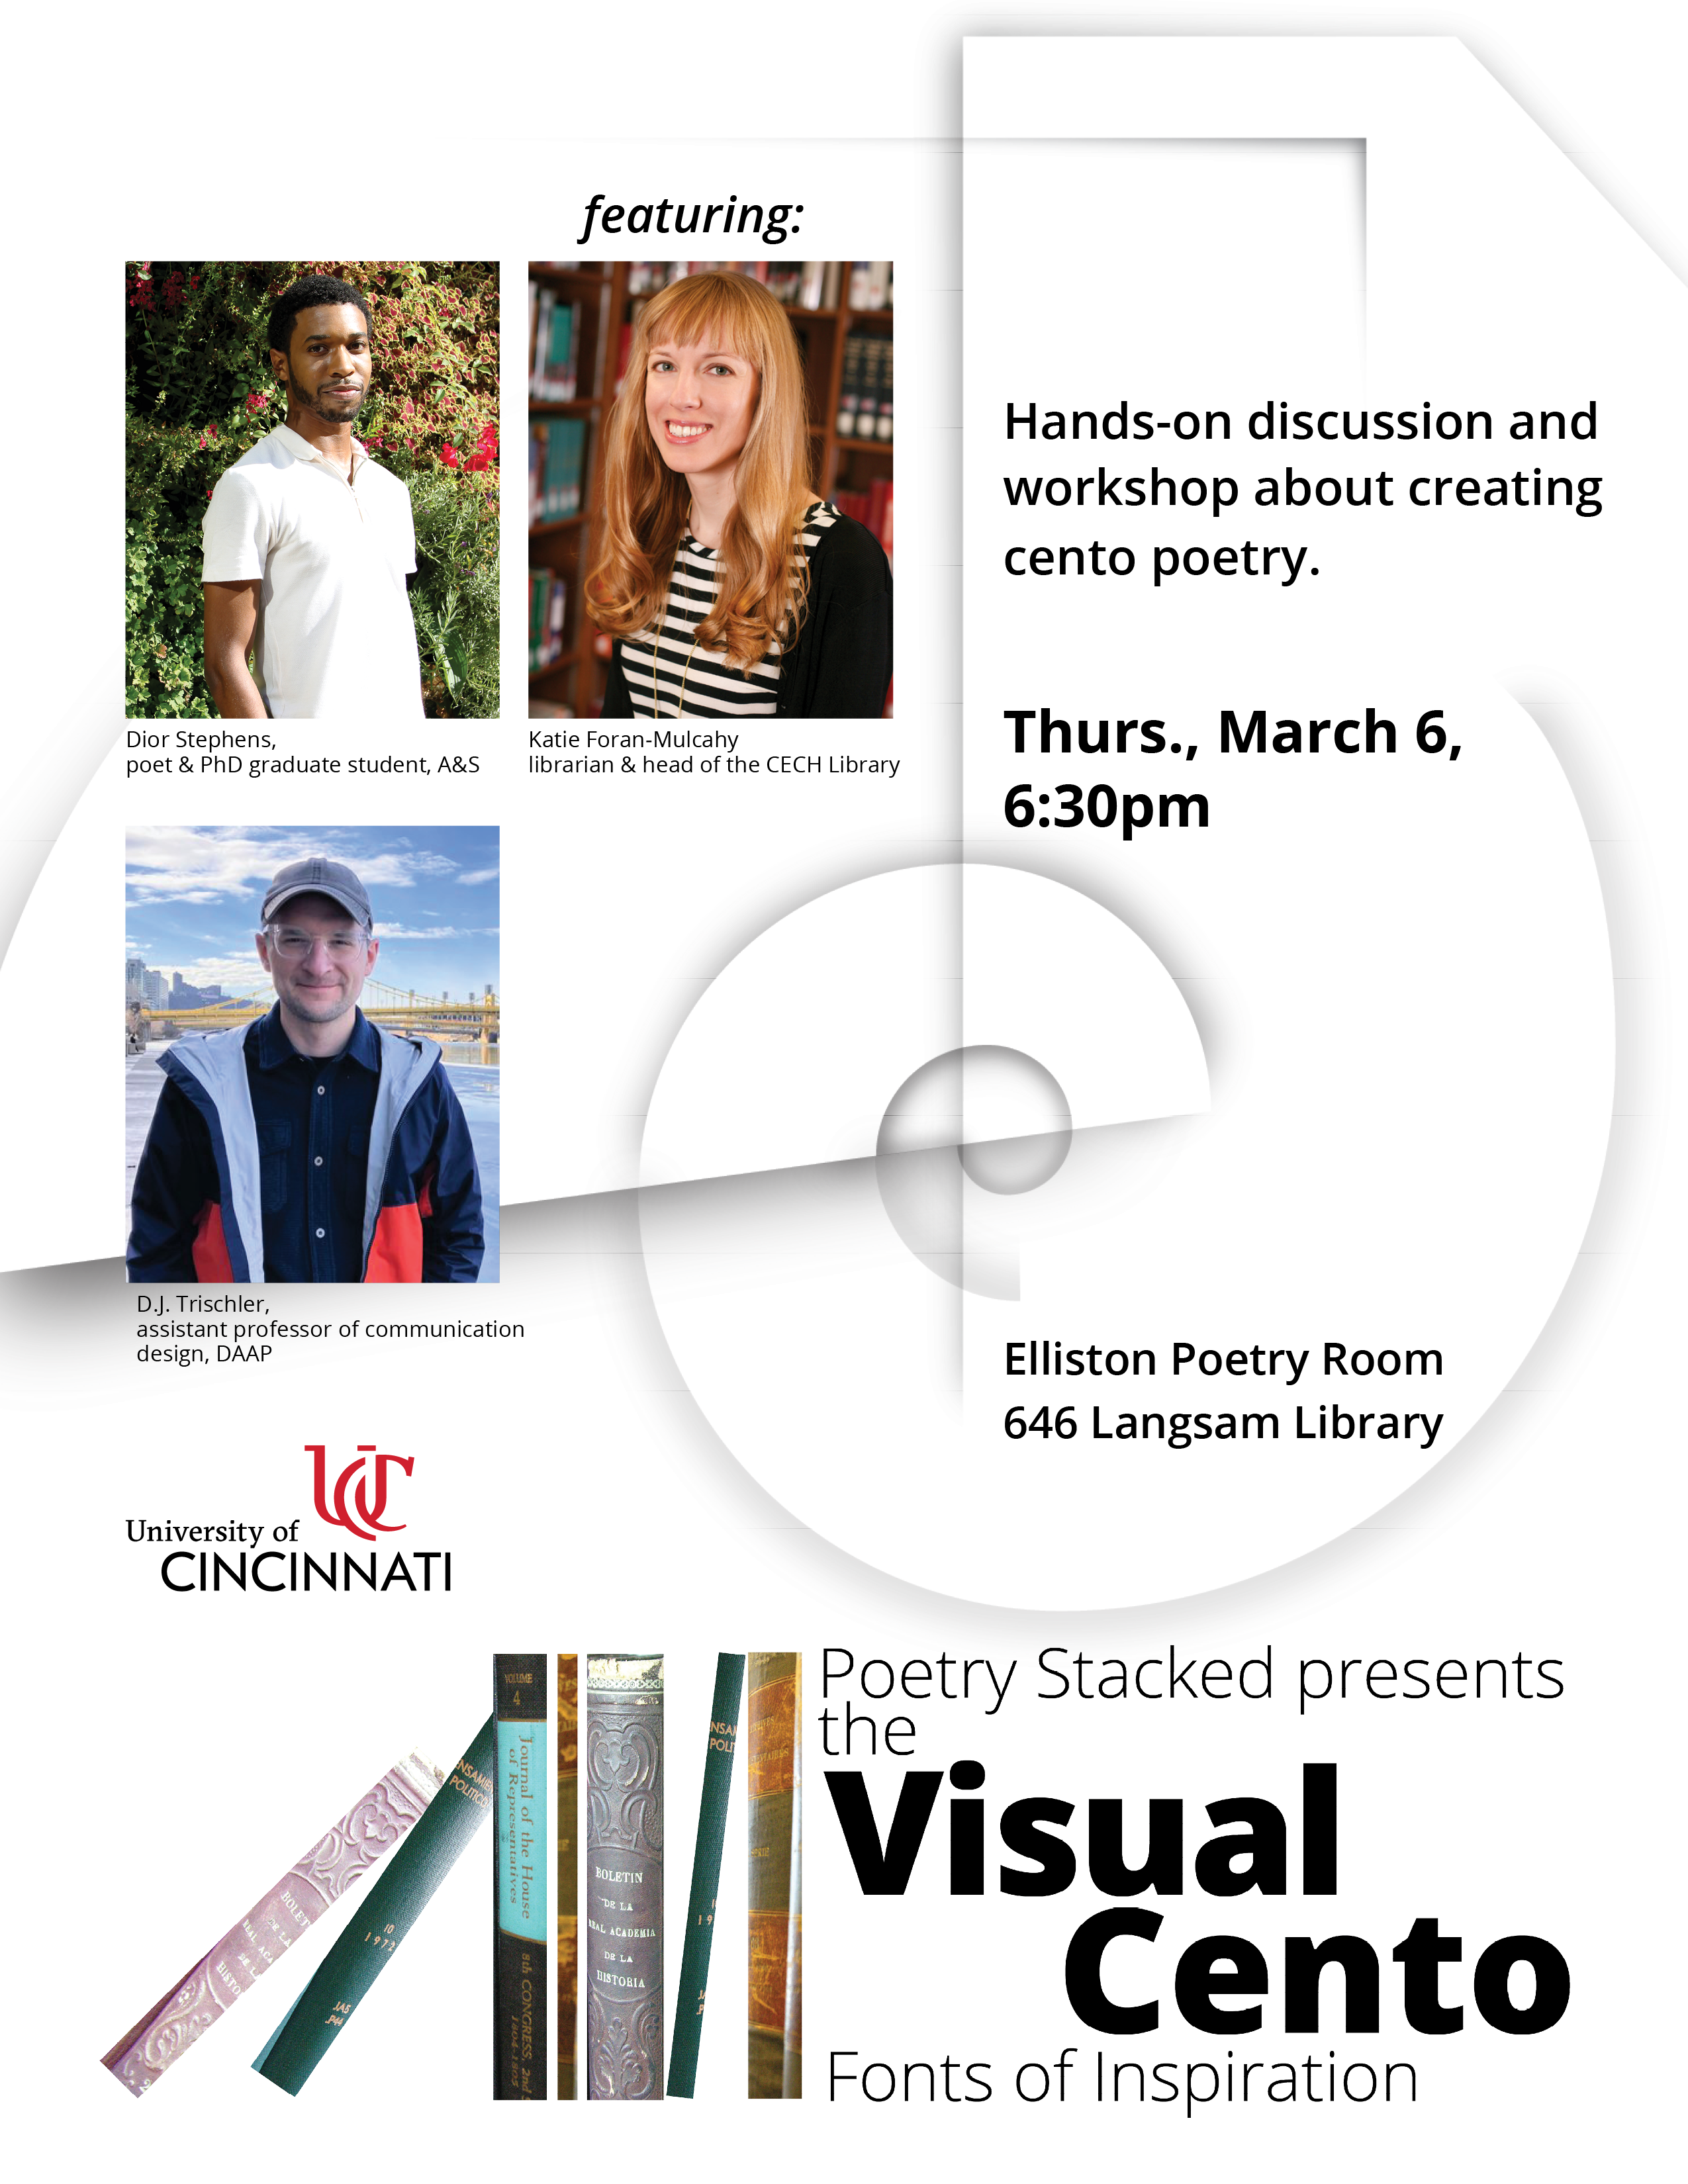
Join the University of Cincinnati Libraries and the Elliston Poetry Room for a hands-on discussion & workshop about creating visual cento poetry.
Dior Stephens, poet and PhD graduate student in the College of Arts and Sciences, will kick things off with an introduction of the cento form. Katie Foran-Mulcahy, librarian and head of the College of Education, Criminal Justice and Human Services Library, will provide an overview of library collections and how to navigate the stacks before sending participants to explore and collect lines and possible visual elements from various texts. D.J. Trischler, assistant professor of communication design at UC’s Ullman School of Design in the College of Design, Architecture, Art and Planning will then talk about found art as the canvas and give tips on how to use text and images to express meaning.
This will culminate in participants creating their own cento poetry – no prior experience required.
UC Clermont Library maintains several book displays across the UC Clermont campus: one that features new materials in the library and three other throughout campus that pertain to timely issues. We feature all of the materials available in these physical displays on our digital display website and on our New Books Blog so that you can explore what is on our physical display shelves from the comfort of your home, access electronic materials, and request items from each display. Our display topics for the month of February 2025 are Black History Month, the Great Backyard Bird Count, and World Day of Social Justice.
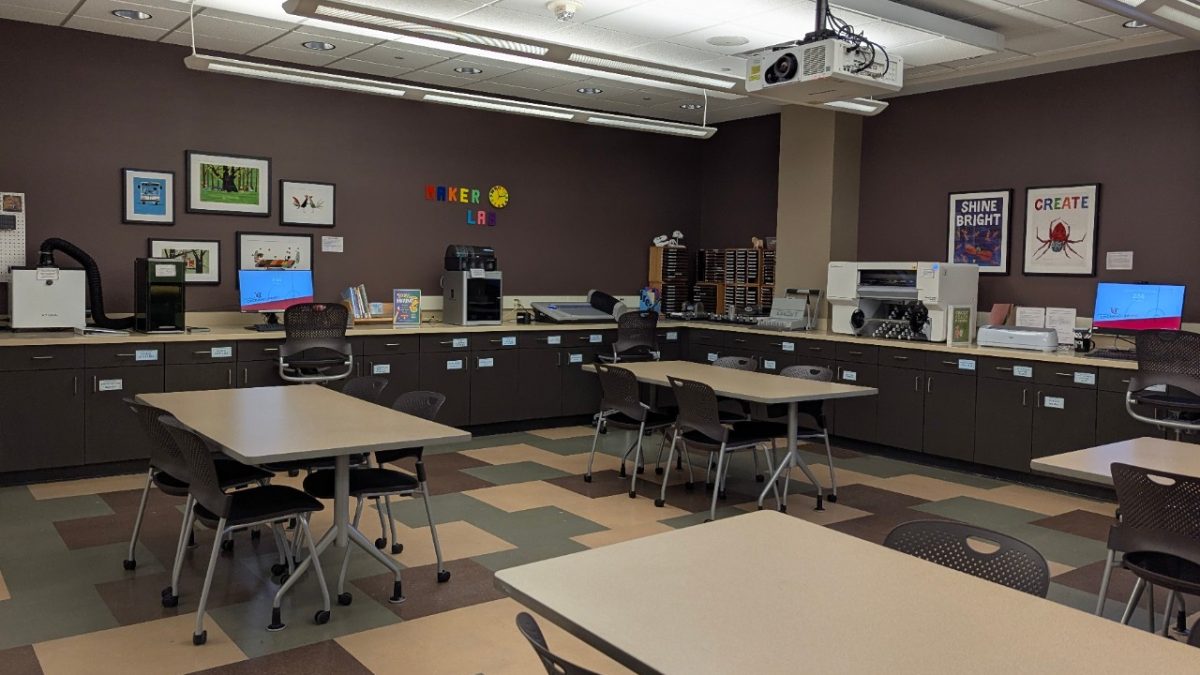
CECH Library is proud to offer a variety of workshops in the MakerLab this semester in support of our pre-service teachers — as well as anyone in our UC community interested in making.
As we did in fall, the library is offering workshops on using the Cricut Maker 3 and Autopress. The Cricut Maker is ideal for cutting paper, vinyl, and more to create custom projects, while the Autopress makes heat transfer projects (i.e. t-shirts and tote bags) quick and easy. Our Intro to Cricut workshop will have two offerings in the spring term, Thursday, February 20 from 3-4:30pm and Thursday, March 27th from 1-2:30pm.
New this spring are MakerLab workshops on 3D printing and sticker making. This equipment for 3D printing and sticker printing/cutting is currently available on a pilot-only basis, but workshop attendees will have special access to these tools during the workshops. Our Tinkercad and 3D Printing workshop will be offered on Wednesday, April 9 from 3-4:30pm and our Sticker Making 101 workshop will be offered on Thursday, April 17 from 1-2:30pm.
Space is limited, so register ASAP to reserve your spot.
The CECH Library is proud to announce that our newest MakerLab equipment is now available on a pilot basis for students of IDT 4015/7115 course, Trends in Learning Technology Innovation. Co-taught by Sarah Schroeder and Katie Foran-Mulcahy, the course focuses on making and makerspaces in K-12 environments.
IDT 4015/7115 students will assist in piloting the newest MakerLab technology acquisitions, including a Bambu x1C 3D printer, a Roland BN-20A printer/cutter, and an xTool F1 Ultra laser cutter and engraver. Students will also provide feedback on the future service model for the MakerLab. With these students’ assistance and expertise, our newest equipment available to all users in fall 2025.
As always, feel free to visit our MakerLab whenever the library is open, and view our website for a complete listing of equipment currently available for use.
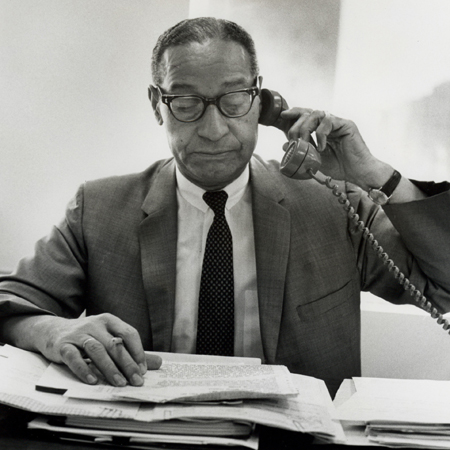
In celebration of Black History Month, we are highlighting African American figures who were influential in their efforts to further civil rights, education and leadership in the city of Cincinnati and America.
Our first spotlight is Theodore Berry. A native of the area, Berry was born in Maysville, Kentucky in 1905. As a young adult, he attended the University of Cincinnati where he received his BA and Law degree, and later in life, his Doctor of Laws.
After his time at UC, Berry served as president for the Cincinnati Chapter of the NAACP, served as morale officer in the Office of War Information, acted as lead defense attorney for the Tuskegee Airmen and served four terms on Cincinnati’s City Council. After an unsuccessful campaign for a fifth City Council term, Berry became a representative for future president John F. Kennedy. Once Kennedy was in office, Berry continued to pioneer civil rights by bringing the NAACP into the White House and serving on its National Board of Directors.
In 1963 Berry was elected for a fifth term on City Council and ended his time there when President Lyndon B. Johnson appointed him director of Federal Community Action Programs and assistant director of the Office of Economic Opportunity. Nine years later, Berry was sworn in as the first African American Mayor of Cincinnati. Berry retired from political life in 1975 and passed away 25 years later in 2000.
Through his life and work, it’s easy to see that Theodore Berry was a figure who was revered, trusted and that he made a big impact on Cincinnati and beyond. We are proud to honor him this month and always.
His papers, including correspondence, photographs, news clippings, reports, studies and minutes of meetings are located in the Archives and Rare Books Library. To learn more about Theodore Berry, visit the digital exhibit:
The University of Cincinnati libraries has chosen not to renew its subscription to RefWorks due to low usage and increasing costs. Access to the citation manager will end at the end of May 2025.
It is highly recommended that users switch to a new citation manager before beginning any new projects that may extend past May 2025 and prior to the May 2025 deadline. Those with questions or who need assistance with switching to a new citation manager should contact a subject librarian or review the Switching Citation Manager help page.
UC Libraries is continuing to provide support for Zotero and EndNote. More information can be found on the Citation Manager Research Guide.
Last November, the University of Cincinnati Libraries announced the award of an Archives Grant from the National Historical Publications and Records Commission to the Libraries’ Archives and Rare Books Library (ARB). This grant supports the archival processing of records related to the lawsuit Bronson v. Board of Education of the City School District of the City of Cincinnati maintained by the local branch of the National Association for the Advancement of Colored People (NAACP) and donated to the University of Cincinnati in the 1980s.
For the continuing blog series on this project, project archivist Julianna Witt provides a timeline of events from the filing of the case in 1974 to its settlement nearly a decade later.
May 29, 1974
Bronson v. Board of Education of the City of Cincinnati is filed on behalf of Mona Bronson, and other school children by the National Association for the Advancement of Colored People (NAACP) to address racial isolation in Cincinnati’s public schools. The lawsuit is filed against the Cincinnati Board of Education, Ohio State Board of Education, State Superintendent, Attorney General, and Governor.
January 30, 1975
The affirmative defense opinion by Judge David S. Porter of the District Court is declared. Judge Porter raises the question whether the decision in the earlier Cincinnati desegregation case Deal v. Board of Education is still viable in the 10 years since the decision and if the same matters can be re-litigated. Judge Porter finds that the decision in Deal v. Board is still acceptable, and the doctrine of res judicata is acknowledged. This doctrine prevents the plaintiffs from relitigating arguments prior to the July 1965 Deal v. Board decision.
April 23, 1975
The plaintiffs file an appeal that transferred the case to the Sixth Circuit Court. Judge C.J. Lively and Judge Harry Phillips find that res judicata does not apply and instead collateral estoppel, which is the least strict of the two re-litigation doctrines. They introduce the fact that this does not prevent the plaintiffs from bringing forth post-July1965 evidence that occurred after Deal v. Board. Pre-Deal v. Board evidence can also be offered, however, only if the evidence is introduced on behalf of children born or not of school age as of July 1965 as long as it does not contradict earlier arguments. A rehearing of the appeal is denied, and the case is returned to the District Court.
June 27, 1980
Judge Porter retires and the case is transferred to Judge Walter H. Rice. Judge Rice issues “Entry Setting Forth This Court’s Interpretation of Sixth Circuit Opinion in Bronson v. Board of Education” which asserts Judge Porter’s affirmative defense opinion.
October 14, 1980
The plaintiffs file a response memorandum with the court that introduces the dual school system theory which was argued in two United States Supreme Court cases, Dayton Board of Education v. Brinkman and Columbus Board of Education v. Penick. Both cases ended in 1979 and evidence in both found that in the Cincinnati schools, dual school systems were existent in May 1954, the date of the Brown v. Board decision. Since this was not discussed in Deal v. Board, the plaintiffs maintain that the case does not have to follow collateral estoppel completely.
February 11, 1982
Judge Rice decides collateral estoppel is still in effect as there is not sufficient evidence to suggest that Cincinnati schools had a dual school system but enough reasoning to consider if evidence is brought forth. The plaintiffs cannot relitigate the exact arguments that were discussed in Deal v. Board. However, they do not have any restrictions when it comes to pre- or post-July 1965 evidence that was declared in 1975 and 1980.
December 19, 1983
Judge Rice accepts the suburban school districts’ motion for summary judgement and dismisses them from the case. In the court pleadings, Judge Rice explains the reason for dismissal as the plaintiffs were unable to produce sufficient evidence to find the suburban school districts guilty of unlawful segregation. Cincinnati Board of Education and the State defendants have not been excused.
April 6, 1984
A settlement is reached and agreed by both sides without going to trial. This does not include the suburban school district defendants, as they were dismissed. The matters of the settlement include:
The Cincinnati Board of Education has seven years to reduce the current Taeuber Index of Dissimilarity score by 17 points. This index measures racial composition within a school compared to the district.
The Board can decide how they will reduce racial isolation. However, they must claim responsibility to achieve the target Taeuber Index score.
The State will provide financial assistance for efforts in reducing racial isolation with some restrictions.
A committee will meet yearly to review the district’s progress.
This project has been made possible in part by grant RH-104772-24 from the National Historical Publications and Records Commission (NHPRC). Any views, findings, conclusions, or recommendations expressed in this blog post do not necessarily represent those of the NHPRC.