ASTM Compass Now Available

ASTM Compass Logo


UC Libraries now has a subscription to ASTM Compass, which includes all ASTM standards, journals and STPs (Special Technical Publications).  Access to standards includes both current and historical versions.

ASTM standards and publications cover many topics: consumer products, science, design, architecture, engineering, 3D printing, medical devices, etc.  Go to  https://www.astm.org/Standards/category_index.html to see an entire list of standards by category.

To access go to https://compass.astm.org/CUSTOMERS/index.html .  If you are off-campus, log in to the UC VPN: http://libraries.uc.edu/off-campus-access.html

Some help using the COMPASS platform:

Two Ohio Supercomputer Center Webinars coming in July

IT@UC is hosting the OSC for two live streaming webinars

JULY 20: BIG DATA @ OSC Workshop: INTRO TO HADOOP & SPARK
Date: Thursday, July 20, 2017 – 1:00 pm to 4:00 pm
Streaming Location: Langsam 475

REGISTER ONLINE  (click yes to – Select if attending the remote event at University of Cincinnati)

JULY 27: PERFORMANCE TUNING WORKSHOP
Date: Thursday, July 27, 2017 – 1:00 pm to 4:00 pm
Location: 850D Baldwin Hall (CEAS Library)

REGISTER ONLINE (click yes to – Select if attending the remote event at University of Cincinnati)

These are live webex events. Brett Kottmann will
be on site. Questions? brett.kottmann@uc.edu

Attached: OSC webcast ad flyer V2_201707

Sign into your ORCID account using your UC login

What is an ORCID?   ORCID stands for Open Researcher and Contributor ID.

You can now access your ORCID account using your UC login.

Visit the ORCID login page and click the Institutional Account button.  Choose University of Cincinnati Main Campus.  You will be prompted to link the two accounts.

Don’t have an ORCID yet?

You can register directly on the website http://orcid.org

OR Even Better

You can access a prefilled registration form linked to your UC email through Scholar@UC on your profile page.

Currently you can enrich your ORCID profile with content in Scholar using a DOI given to the work. (link to video-http://www.kaltura.com/tiny/ycktt 2017-03-17)

For more information about this new login feature, please refer to the blog post from ORCID

https://orcid.org/blog/2016/05/21/what-was-my-password-again

Contact ASKDATA@UC.EDU for more information or with questions.

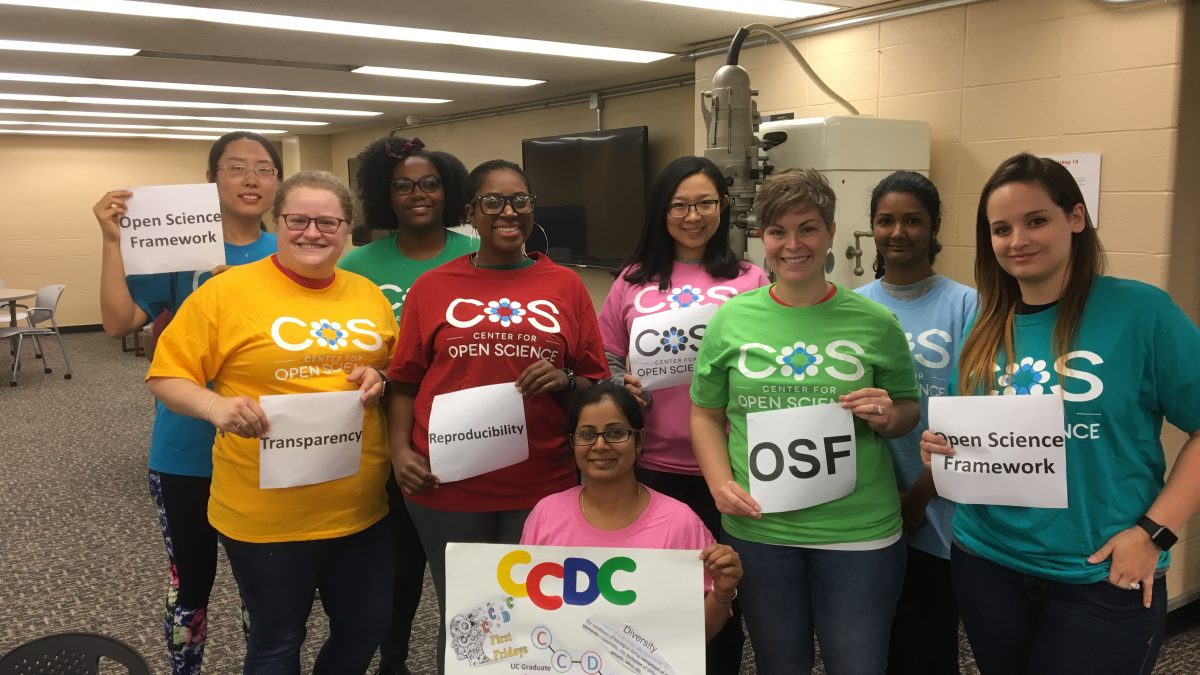
UC Data Day 2017 Featured its First Student Poster Session


The major focus of UC Data Day is to build community around best practices for data and to provide a forum for discussion about challenges and opportunities in data management, data sharing, reproducible research and preservation.

At the first UC Data Day held in 2016, faculty panelists began the conversation and highlighted the diverse and broad approaches to these challenges.  For the second UC Data Day, we wanted to include a student voice as well.

Continue reading

Provost Technology Innovation Award to Fund Data Visualization across Disciplines

The Provost Technology Innovation Award will fund visualization technology for faculty and students to communicate knowledge in graphical form.

data visualtion wall

Vendor supplied photograph of a data visualization wall.

The Office of the Provost has provided more than $1.3 million in funding to collaborating departments and groups across UC, helping each of them push the university community to new academic heights. UC Libraries, partnering with the College of Arts and Sciences, the College of Design, Architecture, Art and Planning, the Carl H. Lindner College of Business and IT@UC  was one of four Technology Innovation Award recipients recently announced with the successful proposal “Data Visualization Across Disciplines: Digital Literacy for the University of Cincinnati’s Third Century.” These partners will work together to invest in the development of an interdisciplinary undergraduate certificate in data visualization; training students to communicate complex data by placing it in a visual context. This cross-college program will incorporate coursework designed and team-taught by faculty, blending multiple perspectives on data visualization to a wide range of students. Data visualization is an emerging art and science that has changed people’s relationship with information. It harnesses new technologies to communicate knowledge in graphical form by merging aesthetic form with analytical function to present large and complex datasets in an intuitive and human-interpretable fashion.

From the Provost Office Announcement – As the University of Cincinnati moves toward its Bicentennial in 2019, the Office of the Provost supports academic and technological innovation keeping our university’s educational mission core to what we do and who we are at UC. This is the drive behind the Provost Technology Innovation Awards program, which funds projects developed by faculty and students who collaborate between colleges and discrete disciplines to support interdisciplinary projects that turn original ideas into reality. “At UC we have a strong, shared commitment to the continued modernization of the learning experience,” says Interim UC Provost Peter Landgren. “It is a pleasure to see the spirit of partnership change and improve the academic journey at the university through collaborative ideas like the ones funded through this program.”

Continue reading

Love Your Data Week Day 4 – Finding the Right Data

Today’s LYD post is by Don P. Jason III, MLIS, MS, Clinical Informationist based at the Donald C. Harrison Health Sciences Library.

Welcome to Day 4 of “Love Your Data Week!” Whether you’re a student analyzing a data set for a school project or a researcher combining data sets to create new insights, finding the right data is essential! This blog post will list a few places you can look to find free, authoritative and unique data sets. The data sets have be broken down into three categories:  US Government Data Sets, International Data Sets and Google Data Sets.

US Government Data Sets

Data.gov http://data.gov – This web site has an eclectic mix of datasets from criminal justice to climate data.  This government site encourages people to use the data to create web and mobile applications and design data visualizations.

US Census Bureau http://www.census.gov/data.html – This web site provides data on the US population and economy.  Utilizing this site’s data has never been easier thanks to new: API’s, data visualizations, mobile apps and interactive web apps.

Healthdata.gov https://www.healthdata.gov/ – This web site includes US healthcare data.  The site is dedicated to making high value health data more accessible to entrepreneurs, researchers and policy makers.

National Climatic Data Center http://www.ncdc.noaa.gov/data-access/quick-links#loc-clim – This is the world’s largest archive of weather data. It has a robust collection of environmental, meteorological and climate data sets from the US National Climatic Data Center.

Continue reading

Patent Searching Workshops in February

UC Libraries is pleased to present a NEW workshop on Patents and Patent SearchingJoin us in 475 Langsam Library.

US Pat 725,069: Body Attachable Sunshade

Instructor: Dylan Shields, PhD Candidate in Chemistry & Grad Assistant in the Chemistry-Biology Library, scilib@ucmail.uc.edu

Description: A general introduction to patents and patent databases. Learn the basics components of patent documents and the various types of patents. Through hands-on examples, learn techniques for searching in some major patent information databases. Workshop materials can be perused at http://guides.libraries.uc.edu/patentworkshop.  The workshop will be taught multiple times in February (same content each time).

To Register: log in with your UC Central Login at the links below.

R Workshops in the Health Sciences Library: Coming Soon

In January 2017 the Health Sciences Library will begin to offer workshops on the R programing language and statistical software.

In these workshops participants will learn:

  • the various data types
  • how to install R
  • how to import and export files
  • how to select statistical methods
  • how to perform different statistical analyses on given data
  • how to understand when to choose a statistical analysis for answering a type of research question

In addition, some basic statistical analyses will be covered that include one sample t-test, two-sample t-test, and different types of regression. At the end of both workshops participants will gain a practical experience of using R programming for Data Analysis.

To register for the January R workshops go to http://webcentral.uc.edu/hslclass/home.aspx .  The January schedule will be posted toward the end of December.

If you have any questions, please contact Tiffany Grant, PhD, Research Informationist at the Harrison Health Sciences Library, at 558-9153 or joffritm@ucmail.uc.edu.

Mastodons on Display in the Geo-Math-Phys Library

Big Bone Lick Exhibit

UC Libraries is honored to host one of four Cincinnati Museum Center collections currently on display at the university as part of the Curate My Community program while the museum undergoes renovation.

Visit the Geology-Mathematics-Physics Library to view Big Bone Lick: A Place of Discovery. From mastodons and sabre-tooth tigers to early American Indians and the Founding Fathers, Big Bone Lick was a gathering place for some of the Ice Age’s most iconic animals, early American hunters and the site of America’s first paleontological expedition, organized by President Thomas Jefferson. The site, and its treasures, continue to be extensively examined by UC researchers.

For more on the Curate My Community Program, visit http://www.cincymuseum.org/curate-my-community.