 UC Libraries will be closed Friday, November 10 in observance of Veterans’ Day, except for the Health Sciences Library, which will be open 9am to 5pm. Normal hours will resume Saturday, November 11. This closing includes the Langsam Library 4th floor space, which will close Thursday, November 9 at 11pm and re-open Saturday, November 11 at 10am.
Category Archives: DAAP Library
Mapathon @ UCLibraries

On Nov 4th, The Red Cross will hold a Missing Maps Mapathon at UC Libraries in 475 Langsam from 10 am to 2 pm. The information collected from a Mapathon helps the Red Cross identify the best locations to bring in emergency supplies, where to house emergency operations and what local resources they can collaborate with in emergency response efforts. In order to participate, you do not need extensive mapping experience. The maps are creating using the Open Street Map platform and you can learn quickly by watching a training video.
If you are interested to participate, please register here – https://goo.gl/forms/Ln4LdEKcFNc7CUTt2 and watch the training video.
Please contact Amy Koshoffer – ASKGIS@UC.EDU if you have questions about the event.
More information in the attached flyer. GIS_LC_20171011_MissingMapsFlyer
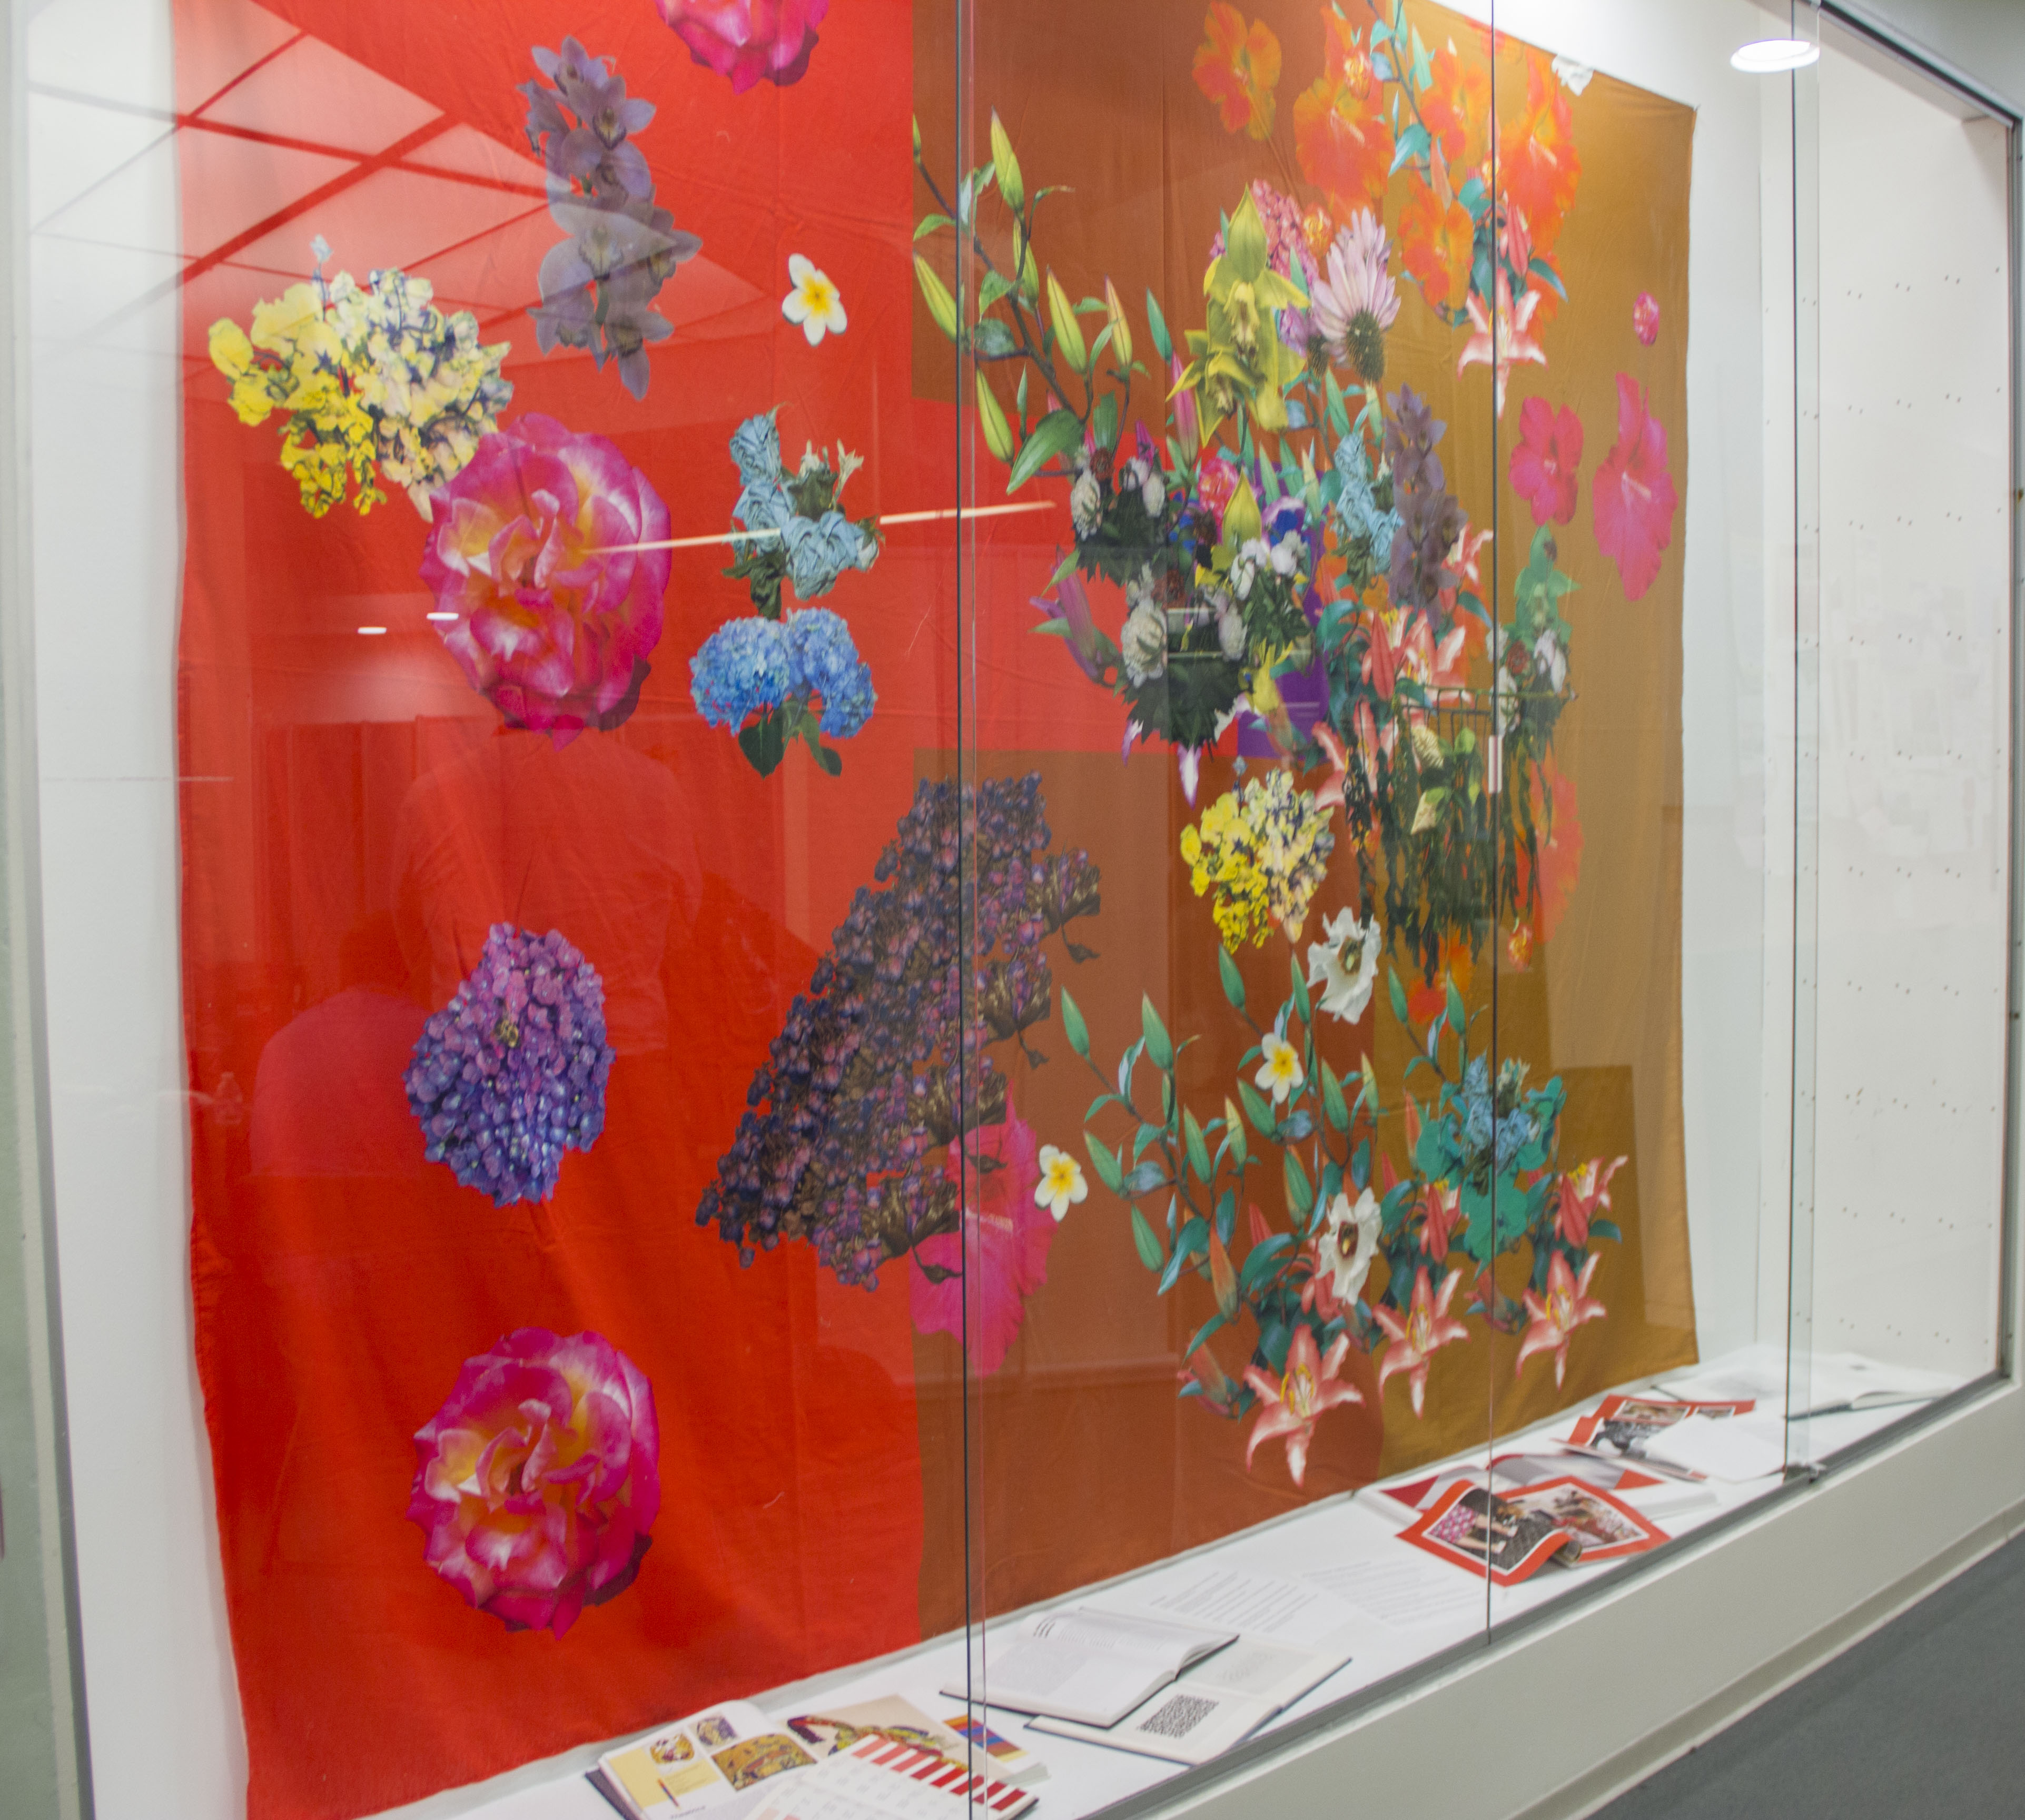
Art Referential: Catherine Richards

DAAP Library Display Case
Art isn’t created in a vacuum, and Art Referential justifies this. Art Referential doesn’t just highlight an artist’s work; it also highlights the rich resources the artist is pulling from.
The second installment of Art Referential highlighted DAAP School of Design Professor, Catherine Richards. We asked Catherine three questions, and these were her answers:
ORCID
 What is ORCID? ORCID stands for Open Researcher and Contributor ID.
Name ambiguity is deceptively tricky. You may share your name with another researcher, like the 10 Steve Smiths on the Center for Science Education’s “List of Steves.” You may change your name due to marriage or other reasons. You may simply use a different version of your name in different contexts, like former Democratic presidential candidate Bernard “Bernie” Sanders.
Enter ORCID: Open Researcher and Contributor Identification. You can think of ORCID as a Social Security number for researchers: a permanent, unique identifier that you can associate with your work to resolve any uncertainty about authorship. Nearly 2 million academics have signed up for an ORCID, in total laying claim to over 12 million documents.
Why do I need an ORCID?
- An ORCID is a unique identifier that allows you to associate your works with your name.
- Removes author ambiguity especially for individuals with common names or for people who change their name through the course of their career.
- Certain Publishers and Granting Agencies require that applicants have an ORCID. https://orcid.org/content/requiring-orcid-publication-workflows-open-letter
- Generating an NIH biosketch is easier with an ORCID.
- You can build an online profile of your scholarly works @ http://orcid.org
How do I get an ORCID?
You can register directly on the website http://orcid.org
Registering for an ORCID is free and takes around 30 seconds.
Upon registering, you can then access your ORCID account using your UC login. Visit the ORCID login page and click the Institutional Account button. Choose University of Cincinnati Main Campus. You will be prompted to link the two accounts.
Ohio Supercomputer Center Workshop – Oct 10th
Posted on Behalf of Jane Combs – combsje@uc.edu.
The Ohio Supercomputer Center will offer two workshops on its resources and how to use them Tuesday, October 10, on both East and West campuses.
IT@UC Research & Development will be hosting the Ohio Supercomputer Center for two workshops on Tuesday, October 10. The morning workshop will provide an introduction to the Ohio Supercomputer Center resources and how to use them. In the afternoon, the workshop will cover Big Data Analytics and Spark.
Register for the workshops HERE
The Ohio Supercomputer Center, headquartered in Columbus, partners with Ohio researchers to develop proposals to funding organizations and is the state’s leading strategic research group.
Most UC Libraries Closed Labor Day, September 4
 UC Libraries will be closed Monday, September 4 for Labor Day, except for the Donald C. Harrison Health Sciences Library, which will be open 9am-5pm. This closing includes the Langsam Library 4th floor space, which will close Sunday, September 3 at 11pm and re-open Tuesday, September 5 at 7:45am.
A complete listing of library hours can be found online at www.libraries.uc.edu/about/hours.html.
Enjoy the long holiday weekend.
Data & GIS Collab hours for the next two weeks
The hours for the Data & GIS Collab (located in the Geo-Math Physics library in Braunstein Hall) for the dates Friday July 7th to Monday July 17th will be as follows:
Friday July 7th the consult hours will be 10 am to 2 pm
There will be no consult hours from Monday July 10th through Monday July 17th. On July 18th the normal schedule will resume.
During these times, both workstations will be available for self directed public use.
This information will also be on the campus guide: http://guides.libraries.uc.edu/GIS/CollabInfo
Email ASKGIS@UC.Edu with questions
Sign into your ORCID account using your UC login
What is an ORCID? ORCID stands for Open Researcher and Contributor ID.
You can now access your ORCID account using your UC login.
Visit the ORCID login page and click the Institutional Account button. Choose University of Cincinnati Main Campus. You will be prompted to link the two accounts.
Don’t have an ORCID yet?
You can register directly on the website http://orcid.org
OR Even Better
You can access a prefilled registration form linked to your UC email through Scholar@UC on your profile page.
Currently you can enrich your ORCID profile with content in Scholar using a DOI given to the work. (link to video-http://www.kaltura.com/tiny/ycktt 2017-03-17)
For more information about this new login feature, please refer to the blog post from ORCID
https://orcid.org/blog/2016/05/21/what-was-my-password-again
Contact ASKDATA@UC.EDU for more information or with questions.
UC Libraries Closed July 4th
UC Libraries will be closed, Tuesday, July 4 for Independence Day. This includes Langsam Library’s 4th floor, which will close Monday, July 3 at 10pm and reopen Wednesday, July 5 at 8am. Normal hours for all library locations will resume July 5th. Have a safe and enjoyable July 4th.
Recording of OSF101 webinar available
If you missed the June 1st webinar about the Open Science Framework, the recording is now available.
Do you have any additional questions or need help getting started? Just email AskData@uc.edu.

