All University of Cincinnati Libraries locations will be closed Wednesday, June 19 in observance of Juneteenth, the oldest nationally celebrated commemoration of the ending of slavery in the United States. Regular library hours for all locations will resume Thursday, June 20.
In observance of the holiday, learn about “Not Racist” vs. “Anti-Racist” Ideologies as part of week three of R.E.S.P.E.C.T.’s annual 21-Day Anti-Racism Challenge — a three-week long, self-guided learning exercise that focuses on different aspects of systemic racism, and how we can all fight against it. And join us Thursday, June 20th from 10:30AM-11:30PM for a Zoom discussion on the challenge, what was learned and how participants can take further action. Join the meeting here, or through the link found on the LibGuide.
R.E.S.P.E.C.T. (Racial Equity Support & Programming to Educate the Community Team) is a UC Libraries committee charged with developing external programming that explicitly addresses the negative role that systemic racism plays in our society.
All University of Cincinnati Libraries locations will be closed Monday, May 27 in observance of Memorial Day. Regular library hours for all locations will resume Tuesday, May 28. Have a safe and enjoyable holiday.
Ted Baldwin, director of the Science and Engineering Libraries and the interim head of Library Collections, and Emily Wages, collection services manager at the University of Cincinnati Clermont’s Frederick A. Marcotte Library, have been voted in by the Directors Council to join the SWON Executive Board in June. They join existing UC Board member Gerry Wagner, unit operations manager in UC Libraries Collection Development Services and Engagement Department.
SWON Libraries formed in 1973 as the “Greater Cincinnati Library Consortium” (GCLC) when a group of library directors in Southwest Ohio and Northern Kentucky wanted a vehicle for pooling resources, sharing knowledge and collaborating to better serve their patrons. They continue that mission today as one of the State Library of Ohio’s Regional Library Systems.
ORCID profiles can now be linked to Github profiles. What does this mean for you? Now you can include your ORCID number on your Github profile. It is also possible to add the URL of your Github account to your ORICD landing page. If you need some help setting up your ORCID or linking these two resources, please contact askdata@uc.edu.
To learn more check out the ORCID blog post on the memorandum.
Check out the new science books that have been added to the Geology-Math-Physics Library. A couple of interesting titles are The Native Landscape Reader and A Spider’s World.
Click here to access the January-February 2024 list.
If you have any questions about these books, contact Ted Baldwin, Director of the Science and Engineering Libraries, at Ted.Baldwin@uc.edu.
Most University of Cincinnati Libraries locations have reduced hours for Spring Break, March 9-16. Check the library website for a list of hours by location.
Have a safe and rejuvenating Spring Break, Bearcats!
Read these articles, as well as past issues, on the website. To receive Source via e-mail, contact melissa.norris@uc.edu to be added to the mailing list
Thursday, February 15, 2024 – Blog Post by Tiffany Grant, PhD, CDE
Today we will focus on diet and nutrition. Poor diet is a leading cause of cardiovascular disease, diabetes, and obesity. Over the last several decades consumption of processed foods and changing lifestyles have led to the development of unhealthy diets. The lockdowns of the pandemic and the increased use of remote technologies have also led to an increase in sedentary lifestyles and habits amplifying the impact of these already unhealthy lifestyles. Eating the right variety of foods in moderation can help to offset this impact and help to reduce the risk of cardiovascular disease and obesity.
What does a healthy diet look like?
The details of a “healthy diet varies for each person, but there are some common threads. Individuals should aim to incorporate nutrient-dense foods like vegetables, lean proteins, healthy fats, and high-fiber carbs and limit low-nutrient, high-calorie foods like sweets, fatty meats, and fried and processed foods.
All healthy eating plans should include:
Fruits and vegetables
Lean meats and plant-based sources of protein
Less added sugar
Less processed foods
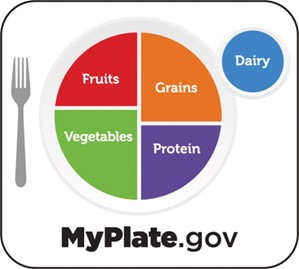
MyPlate.gov
MyPlate is a visual reminder to make healthy choices from each of the five groups. MyPlate.gov offers tips and resources that support healthy dietary patterns.
For healthy recipe ideas, check out My Plate. The MyPlate Quiz is a quick self-assessment tool that provides tailored resources based on answers to a series of simple questions about current eating habits. The results page provides a snapshot of how the user is doing in meeting food group recommendations. The user can then sync quiz results with the Start Simple with MyPlate app to set daily goals organized by food group. Each goal can be personalized to personal preference, cultural foodways, and budget needs, and includes sample tips as starter ideas.
Check out this mini-poster for more information and tips on nutrition, including portion amounts for each dietary component.
Grocery Shopping Tips
First consider your shopping cart divided into fourths.
Fill one half of your shopping cart with fruits and vegetables. These can be fresh, frozen, canned or dried. Start in the produce section to get more fresh produce.
Fill one fourth of the cart with whole grains like bread, tortillas, pasta, brown rice, quinoa, etc.
Fills one fourth with healthy proteins. This can include seafood and lean meats, but also nuts, nut butters, eggs and beans.
Aim to add dairy to your cart. Milk/dairy provides essential vitamins like calcium and vitamin D that you are less likely to get from other foods in the same quantity that milk provides. Other sources of dairy can include, yogurt and cheese. Also, when reading your label, you may find that many sources of dairy are also great sources of protein!
Similarly, your grocery cart should look like your plate.
Half plate of fruit and vegetables
Quarter plate of lean protein
Quarter plate of high-fiber carbohydrates
Nutrition Label Tips
Serving Size, Calories, and Macronutrients
Check serving sizes first! They may not be the same as the usual portion you take or the amount you assume it is.
A can of soup often has 2.5 “servings”, but a person often has 1 full can
A bag of chips often has 3 “servings,” but a person often has 1 full bag
Calories are good to check if you choose to look at just one part of the nutrition label
Fat, carbohydrates, and protein are worth checking
Nutrients to increase
Dietary fiber
Calcium
Potassium
Vitamin D
Nutrients to decrease
Saturated fat
Sodium
Added sugars
Ways to Use Nutrition Labels
Guide to serving and portion sizes
Compare two products to choose the healthier
Limit or increase consumption of calories or certain nutrients
Finding new foods that fit within your plan
List of Ingredients
Listed from highest to lowest quantity in the food product
Use it to find ingredients you may or may not want
You might want:
Whole grains
Olive, soybean, or canola oil
You may not want:
Added sugars like honey, sugar, molasses, corn syrup, high fructose corn syrup, turbinado sugar, agave syrup, brown rice syrup
Hydrogenated oil, partially hydrogenated oil
Nitrites, sodium nitrate
You can also check for preservatives, colors, flavors, and other types of additives
A great resource on reading food labels can be found here.
No material on this site is intended to be a substitute for professional medical advice, diagnosis or treatment. Always seek the advice of your physician or other qualified health care provider with any questions you may have regarding a medical condition or treatment and before undertaking a new health care regimen, and never disregard professional medical advice or delay in seeking it because of something you have read on this website.
Wednesday, February 14, 2024 – Blog Post by Tiffany Grant, PhD, CDE
Did you know…
Prolonged sitting increases risk of spinal, shoulder, carpal tunnel, and leg disorders
Sitting for more than 3 hours/day increases risk for all-cause mortality deaths
Sitting too much increases cholesterol and accelerates weight gain
People who sit most of the day and people who smoke have the same risk of heart attack
Question: What is the single most important thing you can do this very moment for health?
Answer: MOVE!
Regular exercise is one of the most important things you do to improve your health. For those that don’t like the term “exercise”, let’s just use the term “movement” because virtually any movement counts, even those that don’t resonate as “exercise”. Throughout the day, aim to move more and sit less because some activity is better than no activity. Though seemingly small now, it will add up over time to equate to added health benefits.
The CDC recommends 150 – 300 minutes of moderate-intensity physical activity/week or 75 minutes to 150 minutes of vigorous intensity activity/week. These minutes can be broken down into smaller chunks of time, such as 30 minutes/day for 5 days. Your activity can be walking, jogging, running, dancing, biking, mowing the lawn, walking the dog, golf, hiking, or virtually anything that will get you moving.