Love Data Week 2022

graphic representation of International Love Data Week


Love Data Week

UC celebrates International Love Data Week. Feb 14-18, 2022.

UC Libraries will celebrate Love Data Week by hosting several workshops and events around campus.

Love Data Week was started to promote data use in higher education by a collection of academic librarians. It has grown into an international movement where data resources, workshops and collections are showcased during Valentine’s Day week. Learn more about its history and other events at https://myumi.ch/ICPSRldw2022events. #LoveData22

The theme this year is “Data is for Everyone.”
Sponsored by the Research and Data Services Department at UC Libraries along with Office of Research -Research Technologies-Research Computing and Data and the Graduate School, there are events daily to support researchers in every aspect of the data lifecycle from Library, Research Computing, and graduate student team members.

Featuring classes on storage and sharing (GitHub), using GIS to tell a story in a user-friendly format (Intro to Story Maps), data analysis, Introduction to XSEDE Big Data and Machine learning, organizing information (for Grad Students), protecting your own data (Consumer Data Protection), and finding data through patents (Find Patents!), this week will have something for everyone! Continue reading

Data Day 2021 Wrap

Authored by Amy Latessa (OoR Advanced Research Computing team) and Mark Chalmers (UC Libraries – Science and Engineering Libraries)

On November 5th, UC Libraries with collaboration from the OoR Advanced Research Computing team, hosted the 6th annual UC Data Day. The theme of this year’s virtual event was Bias, Miscommunication, and Equity in Data and featured a Keynote by Heather Krause, two interactive panel sessions, and a weeklong virtual screening of the documentary film Coded Bias.  This year’s event had 145 attendees and 29 views of the film. 

Following the opening remarks of Xuemao Wang, Vice Provost for Digital Scholarship and Dean and University Librarian of UC Libraries, Data Day commenced with the keynote by Heather Krause, PStat, and Founder of We All Count. Heather challenged the traditional notion of data’s objectivity, reminding attendees that researchers must make choices and these choices are not objective. Heather also walked participants through several examples of research questions and demonstrated how the questions could be better designed with equity in mind and the onus of change on systems.   She emphasized to participants that there is no “silver bullet” against bias, prejudice, and injustice, and we all must remain vigilant and consider who’s lived experiences are being centered, even at the onset of a project such as when formulating a research question. Heather was engaging and took many thought-provoking questions from the audience.   Continue reading

3C GIS Day(s) Registration is open

Celebrate National GIS Day

GIS stands for Geographic Information Systems.  It is a powerful research tool to create, manage, analyze, and map data based on spatial attributes.

As in 2020 and again in 2021, UC is participating in the statewide 3C GIS Day and there are several ways for you to join the celebration:

1) Register to watch all the virtual events including the Keynote by Chris Fisher of the Earth Archive Project: Register for 3C GIS Day(s).

2) On Nov 17th @ 11 am in 400TUC, watch the Keynote over lunch with your UC Colleagues: Register for in person viewing event Deadline 11/8/2021

3) Showcase your own GIS work by giving a Lightning Talk: Lightning Talk Submission Form – Deadline 10/27/2021

4) Participate in the Map Gallery showcase:  Map Gallery Submission Form – Deadline 11/10/2021

Find more in-depth information on each part of the GIS Day celebration, please visit the event website – https://3cgisday.github.io/.


The event is free and open to all.  Registration is required.

Questions

For general event questions, please contact geospatial@osu.edu.

For the UC specific event, please contact Amy.Koshoffer@uc.edu

UC Data Day, scheduled for Friday, Nov. 5, to focus on bias, miscommunication and equity in data

UC Data Day 2021, scheduled for Friday, Nov. 5, 2021, will offer online panel discussions and a keynote address by Heather Krause, founder of We All Count and the Data Equity Framework, centered around the theme of bias, miscommunication and equity in data. The event will also include a week-long virtual screening of the documentary film Coded Bias and an afternoon panel discussion on Good vs Bad AI.

In order for data to be equitable, the processes involved in the data life cycle must consider the ethical nuances of each step in the process. Careful consideration must be paid to the way that we collect, analyze, interpret and distribute data in order to ensure that bias is not integrated (consciously or unconsciously) into the process. Today we are barraged with information, couched as fact, that is misleading, potentially harmful and that is replete with biases. These miscommunications can lead to the reinforcement of negative stereotypes, poor decision making, social upheaval and mistrust of vetted, factual information. Social Media is often a “mixed bag” of facts and fiction, and many people have difficulty navigating and drawing the line between them. UC Data Day 2021 will take aim at data miscommunication and bias and discuss ways in which data can be re-examined through an equity lens.

More information about Data Days past and present, along with a link for registration, is available on the Data Day website.

data day graphic

In October of 2020, we celebrated our 5th Annual Data Day event. As we prepare for subsequent similar events, we would like to assess the impact of our previous events on those that attended. We are asking that if you have attended any Data Day event in the past that you would kindly take a few moments to participate in a survey to assess your experiences. Your responses will be confidential unless you choose to submit your contact information for further inquiries regarding the events.

Please use this link to access the survey: https://redcap.link/ucdataday. Please know that your feedback is very important to us, and we appreciate your time filling out the survey.

3C GIS Day(s) 2021: Save the Date and Call for Proposals 

3C GIS Day(s) 2021: Save the Date and Call for Proposals 

Save the Date 

Join us during the week of November 15-19 for a virtual GIS Day program featuring a keynote speaker, lightning talk sessions, and a digital map gallery. This event is free and open to the public, and registration details will be available soon. 

GIS stands for Geographic Information Systems.  It is a powerful research tool that makes use of the geospatial attribute of data.  One of the oldest and most famous examples is the map showing how John Snow was able to determine the source of a cholera outbreak in London from the location of sick individuals.   

 3C GIS Day(s) 2021 is a collaboration between Case Western Reserve University, The Ohio State University, and the University of Cincinnati. 

Lightning Talk Call for Proposals 

The 3C GIS Day(s) planning committee invites submissions for lightning talks (10 minutes) from any faculty, staff, or students affiliated with one of the three organizing institutions. We encourage submissions from any disciplines that use geospatial information in any format, such as agriculture and environmental sciences, geography, engineering, business, health sciences, urban planning, and the humanities and social sciences, among others. We especially encourage submissions from graduate and undergraduate students who would like to showcase their work through a fun and informal presentation opportunity. 

Please submit your lightning talk proposal by Friday, October 15Lightning Talk Submission Form. 

Information collected during the submission process includes presenter name and affiliation, availability during proposed sessions times, and presentation details (title, brief description, and any collaborators). 

If you have questions, please contact geospatial@osu.edu. 

Stay Tuned 

As part of this program, we’ll also be organizing a digital map gallery for affiliated faculty, staff, or students to showcase their original cartographic work, including both static and interactive maps. More information and a map gallery submission form will be available in the coming weeks. 
Read Source for the news, events, people and happenings in UC Libraries

source graphic

Read Source, the online newsletter, to learn about the news, events, people and happenings in UC Libraries.

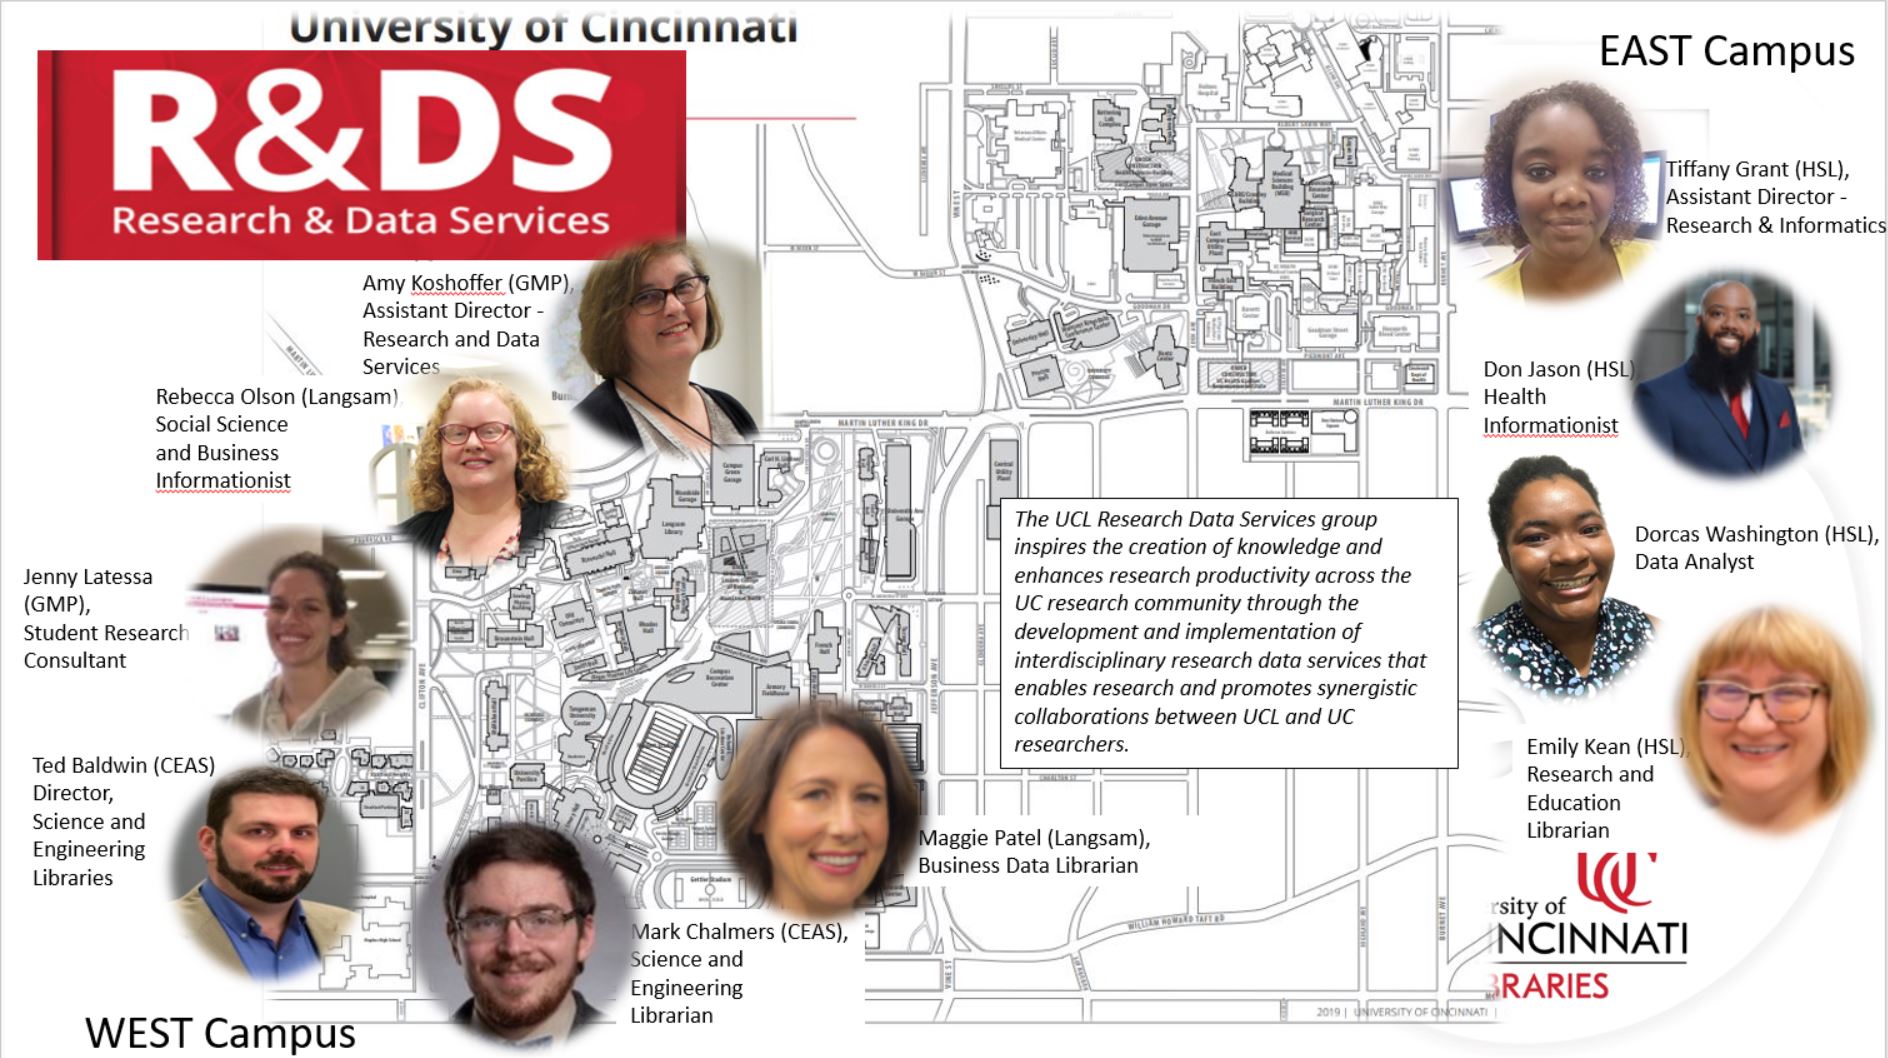
In this issue of Source, as we mark the 20th year of publishing our newsletter, Dean Xuemao Wang welcomes students back to campus. We spotlight a library staff member, Ben Kline, and special collections in the DAAP Library and the newly digitized OMI posters, as well as a team bringing research and data services to the university community. In addition, we announce upcoming events – Life of the Mind and The Illustrated Human: The Impact of Andreas Vesalius.

Read these articles, as well as past issues, on the website. To receive Source via e-mail, contact melissa.norris@uc.edu to be added to the mailing list.

UC Libraries Research And Data Services Team is here to help you

Welcome back to campus and a really big Welcome

to new students, staff, and faculty.

After you settle in and start to plan and implement your research projects, you may have questions about doing research here at UC.  The UC Libraries Research & Data Services is one of many support groups on campus to help you. We have information professionals and physical locations within various UC Libraries locations on East and West Uptown campuses to help all UC researchers.

We have vast and varied expertise and we can help you by

  • Supporting you throughout the research lifecycle
  • Helping you use tools such as:
  • Supporting Bioinformatic resource
  • Teaching and consulting on Data and Spatial analysis tools
    • SPSS, R, QGIS, ArcGIS (Desktop and Online)
  • Supporting data preservation and sharing resources
  • Explaining, finding, and using scholarly metrics i.e. impact factor, H-index, etc.
  • Explaining, finding, and using persistent identifiers such as ORCID and DOIs
  • Encouraging you to register for our workshops in Faculty OneStop
  • Teaching workshops focused on research and data recommended practices
  • Coming in for a consult at one of our locations.
  • Partnering with you on projects in scope with our mission and skill set.

We sponsor signature events such as Data Day (Nov 5th) and GIS Day (Nov 17th) through our Data and Computational Science Series and invite you to attend.  Here is a brief list of upcoming events and workshops focused on research.

August 31: Machine Actionable Data Management Plans And The Dmptool

September 8: R Introduction Workshop

September 14: ESRI’s StoryMaps

We are here to help you develop research efficiencies and make the most of your research.  We look forward to meeting you and hope to see you at our workshops and events.   And we are here so you get the information and resources you need, and we hope to partner with you on your research projects.

Contact us at:

Email – ASKDATA@UC.EDU 

Website – https://libraries.uc.edu/rds.html

Do You Miss Statista?

Last Fall, UC Libraries made the tough decision to break up with our Statista subscription.  The decision came down to two reasons: 

  1. Statista’s price rose over 200% in the past two years
  2. More importantly, Statista’s data is accessible from other vendors and resources.  The Statista  platform serves as a portal to finding statistics. Basically, subscribers pay for ease of access to a  lot of statistics. Most of these statistics come from government resources, industry associations, and other vendors of statistical information.  

A few examples:  

  1. Data Planet
    Touted as the “largest repository of standardized and structured statistical data”. It has 13.5 billion datasets, pulls from over 90 data providers and covers 16 major subject categories. It also provides users with tutorials on how to analyze data and incorporate it into their research. 
  2. US Census
    One of the largest producers of social and economic data and statistics. The economic census includes Trade, Manufacturing, Construction, Financial, Insurance and Real Estate statistics. 
  3. FRED (Federal Reserve Economic Data)
    Economic data out of the St. Louis Federal Reserve Bank including inflation rate, consumer price index, unemployment rate, and more. FRED also provides a lot of teaching resources for economic data.  
  4. Market Research Reports from IBIS, Mintel, Euromonitor and many more!
    UC Libraries subscribes to many market research databases.  These reports provide domestic and international industry level data as well as consumer demographics and statistics. 

These databases and resources are accessible through UC Libraries and UC’s research guides. These resources are being updated these through the Summer, so please check back to see what’s new. 

If you are looking for something specific, please think of Maggie Patel (UC’s Business and Data Analytics Librarian) as your statistical matchmaker and she will work with you to find the appropriate resource.  You may contact her through email.

Please don’t despair if you loved Statista, there are plenty of other statistical databases in the sea.  You will improve your research skills and discover new statistical resources. Fall in love again with something new! 

UC Libraries Mark Chalmers named Drexel University LEADING Fellow

mark chalmersMark Chalmers, science and engineering librarian, has been accepted into Drexel University’s highly selective Library Information Science (LIS) Education and Data Science Integrated Network Group (LEADING) program as a 2021 LEADING Fellow.

The LEADING program is a Laura Bush 21st Century Librarian (LB21) National Digital Infrastructures and Initiatives project, supported by the Institute of Museum and Library Services (IMLS) and hosted at Drexel University’s College of Computing & Informatics (CCI). The LEADING program scales-up the highly successful LEADS-4-NDP initiative and will prepare a diverse, nation-wide cohort of 50 LIS doctoral students and early to mid-career librarians for data science endeavors.

LEADING Fellows will complete the following:

  • self-paced online preparatory curriculum,
  • an online data science bootcamp with Drexel and other LEADING fellows,
  • six-month virtual data science internship at a LEADING hub or node,
  • development of a communication plan to connect with mentor/s on a regular basis, and
  • development of research output (e.g., a paper, poster, presentation, published data, etc.).

Mark’s LEADING Fellow research project will focus on “Assessing Overlap and Aggregation Potential of Open-Source Software Platforms and Their Data.” LYRASIS, a consortium that provides access to the world’s shared academic, scientific and cultural heritage, currently offers six hosted services on open-source software. Five of the six of which involve academic libraries and their cultural heritage assets. As a result, LYRASIS seeks expertise in cultural heritage metadata and data science to assist in assessing this overlap between platforms. In addition, they seek recommendations on how machine learning models can be leveraged to connect data in different platforms and to assess how researchers can be served by access to data across the different platforms.

“I am eager to work with Drexel and LYRASIS to grow my competencies in the domains of data science, data integration, large scale machine learning and exploratory feasibility projects,” said Mark upon learning of his acceptance into the LEADING program.

“The experience and skills Mark will gain as a LEADING Fellow will not only contribute to the completion of the LYRASIS research project, but he will bring new knowledge back to his role in the Science and Engineering Libraries while at the same time contributing to the university’s digital future and open access agenda,” said Xuemao Wang, vice provost of digital scholarship and dean and university librarian.

Love Data Week, Feb 8-12, 2021.

Love Data Week 2021

Love Data Week 2021

Love Data Week takes place the week of Valentine’s Day. Created to raise awareness of research data management, sharing, reuse, and preservation of data, it has been promoted by library and data professionals since 2016 in both online and in-person events.  You can see some of the events taking place around the world at the International Love Data Week 2021 schedule.

One of the ways we at RDS/UCL celebrate is to participate in the Adopt a Dataset program that ICPSR hosts every year.  ICPSR choses to highlight interesting data sets from their collection for individuals to explore to learn more about data. Once a dataset is chosen, you may fill out the Dataset adoption form and have your name added to the wall of adopters.  Adopters are encouraged to delve into the data by reading about the research, look at the variables, try out the analysis tools online, and read related publications.

ICPSR is a member consortium that UC belongs to that provides access to datasets from over 15,000 studies, over 5.6 million variables, which have had over 95,000 publications that cited those studies. It also provides curated data repository services for researchers, including secure data enclaves, which fulfill finding requirements for data management plans. Although most studies are quantitative in the social and behavioral sciences, there are also themed collections in the arts, humanities, and some health sciences. Teaching resources, online analysis tools, and pre-made exercise modules also are available to members.

There are a wide variety of datasets to choose from this year, ranging from education, to social media, social justice, to health. I chose to adopt one on music, Study of Jazz Artists, 2001 (ICPSR 35593). I started out by looking at the description of the study and how it was conducted. I then jumped into browsing the variables, one of the tabs found on the data set page. One of the great features of ICPSR is that you can search by variable if you are looking for specific studies to replicate or want to see if your own survey questions fit what others have asked in the past.

One variable jumped out at me – Q32- Age Began Playing First Instrument. My own children play instruments and I always wonder if we’ve started them at the right age or not. Looking at the result for this variable, I can see the unweighted results, including summary statistics and a variables chart. The median age was 9, the mode was 10, the maximum was 35, and the minimum was 1! I guess there’s still hope if you’re in your 30s to pick up an instrument to become a professional jazz musician!   The sweet spot to start your child appears to be the 8-10 year old range.

If you have questions about Love Data Week,  ICPSR, Data, Data Management Plans, Cleaning, Storing, Finding, or Using Data, contact us at Research and Data Services here at UC Libraries. We would love to help you with your projects, offer a workshop to your department or class, or discuss your data needs.